
, ETMarkets.com|

1/4
Bullish scanner
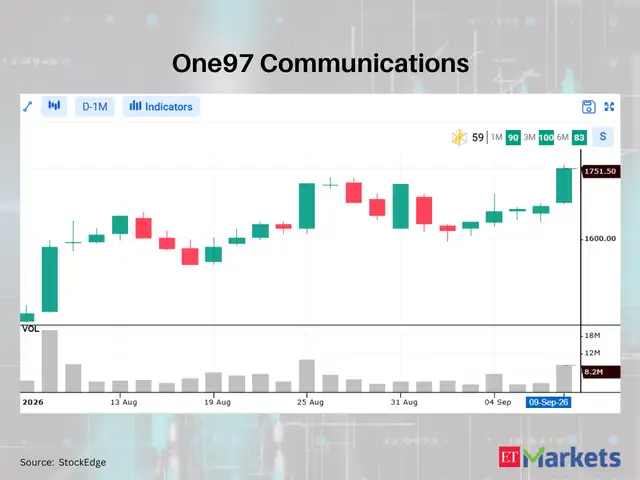
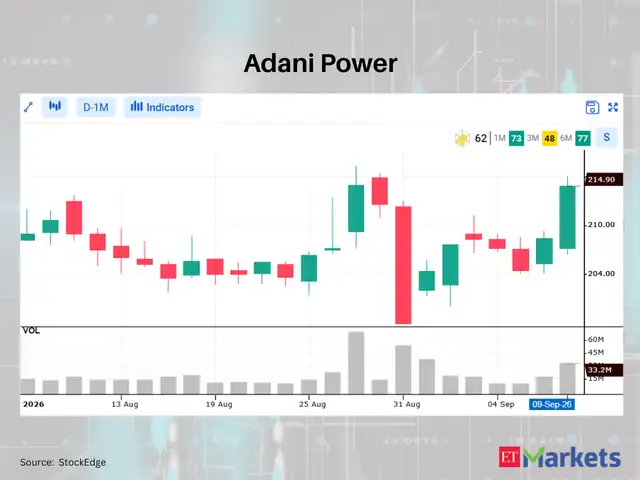
On September 9, three stocks in the Nifty500 appeared on the ‘White Marubozu’ bullish scanner, according to StockEdge’s technical scan data. A White Marubozu is a bullish candlestick pattern in technical analysis that occurs when the opening price is the lowest for a given period, and the closing price is the highest.
ETMarkets.com
The pattern is represented by a long white (or green) candlestick with no upper shadow and little or no lower shadow. It reflects strong upward price movement during the session, with the price moving from the opening level towards the session high by the close. The pattern is commonly studied in technical analysis as an indicator of price momentum.
2/4
Close: Rs 1,751.5 | Change: 4.88%One97 Communications (Paytm)
ETMarkets.com

3/4
Close: Rs 1,037.5 | Change: 4.48%Max Healthcare Institute
ETMarkets.com
4/4
Close: Rs 214.9 | Change: 3.12%Adani Power
ETMarkets.com
